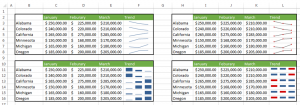
Sparklines are tiny graphs that fit in a single cell. Excel 2013 offers a few varieties and options.
1. First, select your data
2. Under the Insert tab, in the Sparklines group, choose either Line, Column, or Win/Loss
3. In the pop up window, confirm the correct data is in the Data Range. Then update the Location Range to choose where your sparklines should go. You can select cells that already contain data if you prefer.
4. Click OK.
There are options for changing color, weight, and the design of the Sparklines in the contextual design tab. Just click on the Sparklines to make the tab available.


