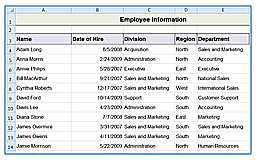
In today’s data-centric business environment, the ability to analyze information and make informed decisions is crucial. Microsoft Excel, a powerful tool for data analysis, can help professionals at all levels unlock insights that drive better business outcomes. By mastering Excel, you can transform raw data into actionable insights, guiding strategic decisions and improving overall business performance. In this article, we’ll explore how you can leverage Excel for data-driven decision-making.
Why Excel is Essential for Business Data Analysis
Excel is a versatile and widely used tool in business environments for a reason—it offers a range of functionalities that make data analysis accessible and efficient. Whether you’re managing large datasets, performing complex calculations, or visualizing trends, Excel provides the tools needed to turn data into actionable insights.
User-Friendly Interface
Excel’s user-friendly interface allows professionals to easily organize, manipulate, and analyze data. With features like pivot tables, charts, and data validation, Excel helps simplify the process of data analysis, even for those who may not have a strong background in data science.
Extensive Analytical Tools
Excel is equipped with a wide array of analytical tools that support data-driven decision-making. From basic functions like SUM and AVERAGE to advanced tools like VLOOKUP, INDEX-MATCH, and Data Analysis Toolpak, Excel can handle everything from simple data summaries to complex statistical analysis. These features empower users to draw meaningful conclusions from their data and make informed decisions.
Key Excel Features for Data-Driven Decision Making
Pivot Tables for Summarizing Data
Pivot tables are one of Excel’s most powerful features for data analysis. They allow you to quickly summarize large datasets, identify trends, and extract key insights. By organizing data into rows and columns and applying filters, you can easily explore different angles of your data and focus on the most relevant information for decision-making.
Conditional Formatting for Highlighting Key Data
Conditional formatting is a useful tool for emphasizing specific data points within your spreadsheet. By applying formatting rules, you can highlight trends, outliers, or key performance indicators (KPIs) that require attention. This visual approach makes it easier to spot patterns and anomalies, aiding in quicker and more accurate decision-making.
Data Visualization with Charts and Graphs
Visualizing data through charts and graphs is essential for communicating insights effectively. Excel offers a variety of chart types, including bar charts, line graphs, pie charts, and scatter plots, that can help you present data in a clear and compelling way. By turning data into visual formats, you can more easily convey the story behind the numbers to stakeholders, making it easier to justify decisions based on data.
Advanced Functions for Deep Analysis
Excel’s advanced functions, such as VLOOKUP, HLOOKUP, INDEX-MATCH, and IF statements, enable you to perform more sophisticated analyses. These functions can help you cross-reference data from different sheets, conduct what-if analysis, and automate complex calculations, providing deeper insights into your data and helping you make better-informed decisions.
Data Validation for Ensuring Data Accuracy
Accurate data is the foundation of sound decision-making. Excel’s data validation feature helps ensure the integrity of your data by restricting the type of data that can be entered into a cell. This minimizes errors and ensures that your analyses are based on reliable information, leading to more accurate outcomes.
Applying Excel for Strategic Decision-Making
Financial Analysis and Forecasting
Excel is an indispensable tool for financial analysis and forecasting. Whether you’re analyzing cash flow, projecting future sales, or evaluating investment opportunities, Excel’s financial functions and modeling capabilities allow you to create detailed financial models that support strategic decision-making. By applying Excel’s scenario analysis tools, you can assess different financial outcomes and choose the most advantageous path for your business.
Operational Efficiency and Performance Tracking
Excel can also be used to monitor and improve operational efficiency. By tracking KPIs and other performance metrics in Excel, you can identify areas for improvement, streamline processes, and optimize resource allocation. Excel’s ability to integrate with other data sources makes it a central hub for tracking and analyzing performance across various aspects of your business.
Marketing and Sales Analytics
For marketing and sales teams, Excel offers robust tools for analyzing campaign performance, customer data, and sales trends. By leveraging Excel’s data analysis features, you can segment your audience, track customer behavior, and measure the effectiveness of marketing strategies. This data-driven approach allows you to make informed decisions that drive revenue growth and enhance customer engagement.
Inventory Management and Supply Chain Optimization
Excel’s data management capabilities make it an excellent tool for inventory management and supply chain optimization. By analyzing inventory levels, supplier performance, and demand forecasts in Excel, you can optimize your supply chain, reduce costs, and ensure that your business operates smoothly. Excel’s forecasting tools can also help you anticipate demand fluctuations and adjust your inventory accordingly, preventing stockouts and excess inventory.
Mastering Excel for Business Success
Excel is more than just a spreadsheet tool; it’s a powerful platform for data-driven decision-making that can significantly enhance business productivity. By mastering Excel, you can unlock new opportunities for growth, streamline operations, and make better-informed decisions that drive success.
At AdvantEdge Training & Consulting, Inc., we offer comprehensive training programs designed to help professionals master Excel and other key business tools. Our courses are tailored to your needs, ensuring that you gain the skills necessary to leverage Excel for data analysis and decision-making in your specific role.
Contact AdvantEdge Training & Consulting, Inc. today to learn more about our Excel training programs and how they can help you and your team make smarter, data-driven decisions.


