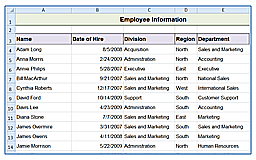
All too often, when we are sent data from someone, it is not presented in the view we would like. Changing the way our data looks, and being able to do it quickly, can save us some time, when we use the right tools.
In some cases, using a table has some advantages, while using just the drop-down filtering has different advantages. For example, some functions do best when contained in a table; so using regular drop-down filters allows for more complex functionality. Tables, on the other hand, have added functionality to add colors, totals (sum, average, etc.) at the bottom of the data, slicers, and other items not included with drop-down filters.
In our video, we are going to add drop-down filters, and walk through some of the functionality for filtering. Remember, the drop-down filters we use in the video are also available when the table functionality is used for data.


